GPU Frequency
Let’s first start by looking at the real-world gaming GPU frequency between each power mode. In the graphs below we are showing all three power modes compared on one graph for each video card separately. Optimal Power is in orange, Adaptive is in blue and Prefer Maximum Performance is in green. Where overlaps occur, you may only see one color.
GeForce RTX 2080 SUPER
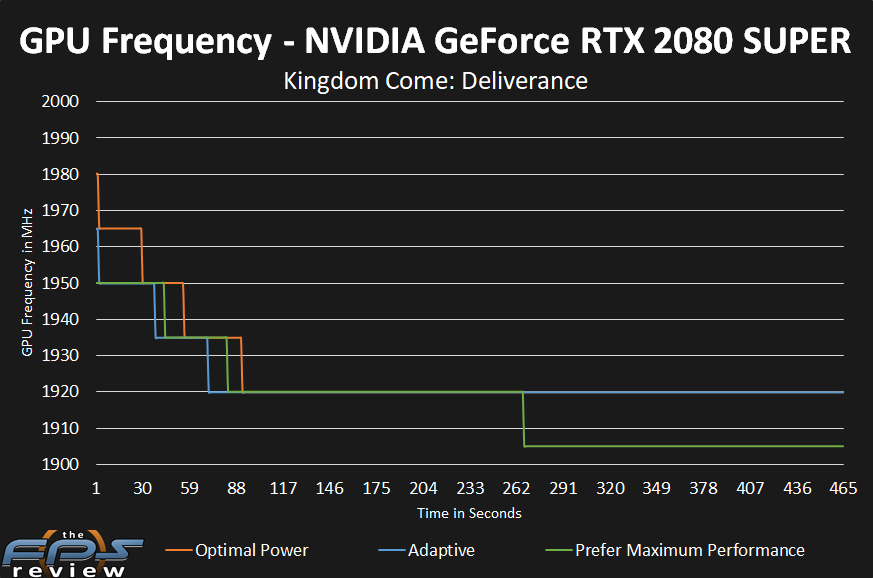
From the get-go these results are interesting. Let us break it down for you. In all power modes the clock speeds start at a high level and step down to their final resting spot, this is normal and it happens the same way at the same time in each power mode.
At the 1920MHz mark, you see the blue line of the Adaptive option, what you don’t see is that underneath that line is the orange line for Optimal Power as well. That means both Optimal Power and Adaptive consistently have a frequency that comes out to 1920MHz and it doesn’t change.
However, something a bit different happens with the Prefer Maximum Performance option. It starts off at 1920MHz like the others, but then half-way in it drops in frequency down to 1905MHz and stays consistent at 1905MHz the rest of the game.
That means the Optimal Power and the Adaptive option are actually maintaining a higher frequency at 1920MHz throughout the game. The Prefer Maximum Performance actually drops clock speed for some reason a ways in down to 1905MHz. We don’t exactly know why perhaps it is hitting the TDP wall faster?
The average of the clock speeds turns out to be the following.
Optimal Power – 1925MHz
Adaptive Power – 1923MHz
Prefer Maximum Performance – 1914MHz
GeForce RTX 2060 SUPER
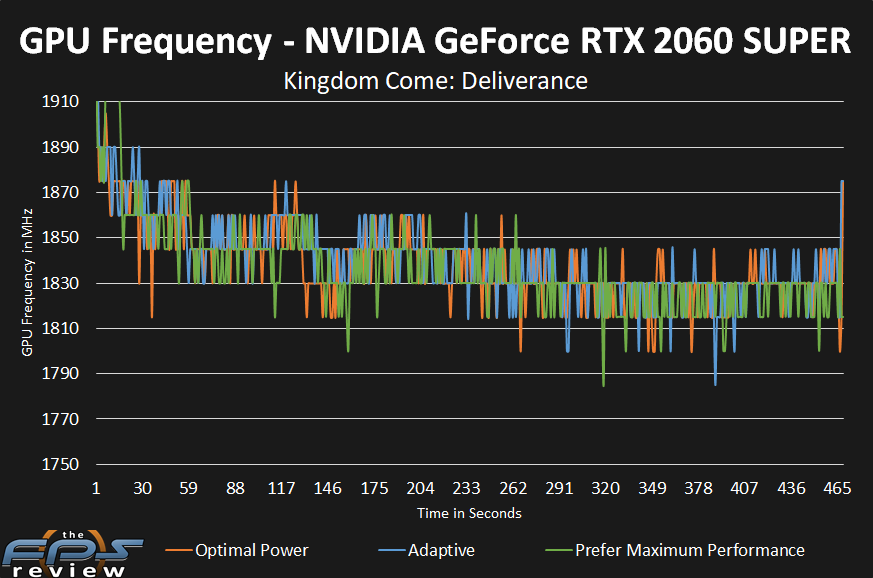
In the above graph, we are looking at the GPU frequency on the GeForce RTX 2060 SUPER FE. First of all, it is much more erratic than the RTX 2080 SUPER FE was in every power mode, so at least they are all consistent in that way.
This graph may be hard to read or look like a mess, but what it shows is that there really aren’t any differences at all between clock speed. For this video card, every power mode has the same clock speed result. We can confirm this by taking the average of the clock speeds, which turns out to be the following.
Optimal Power – 1839MHz
Adaptive Power – 1841MHz
Prefer Maximum Performance – 1836MHz
As you can see the averages are very close between all three, there isn’t a major advantage with any power mode here on this video card.