Power and Temp
Now we have the important power and temperature comparisons. We are going to show one graph per video card that contains all the temperature and Wattage information in one place. We’ll walk you through the graph.
The green bar at the top will represent the total system Wattage at full-load. The yellow bar below that one represents the GPUz Power Consumption board power result. The blue bar below that represents the Idle total system Wattage. Finally, the orange bar at the bottom represents the GPU Temperature in Celsius.
GeForce RTX 2080 SUPER
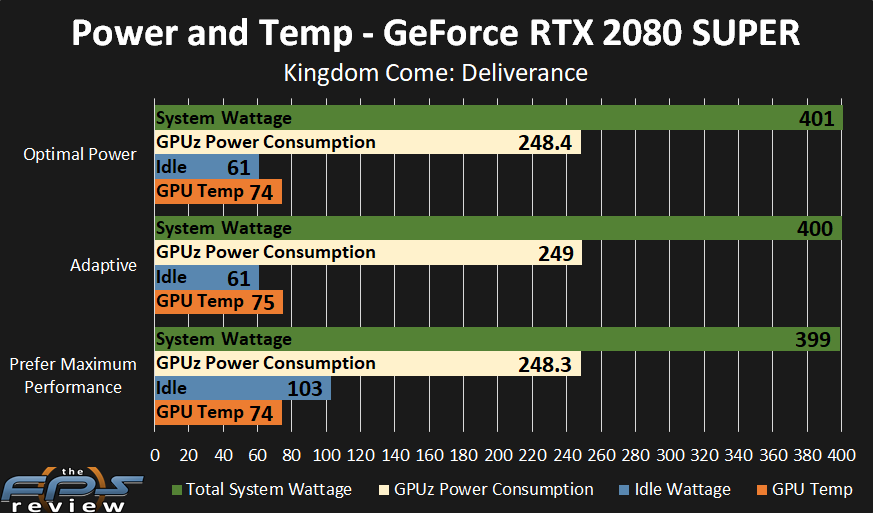
Let’s start at the bottom and work our way up. The orange bar represents GPU Temperature. We see no differences in GPU temperature between the different power modes, none of them seemed to affect the GPU temperature at full-load while gaming.
However, the power modes do directly affect the blue bar, the total system Idle Wattage. In Optimal Power and Adaptive, it is similar at 61W. However, at Prefer Maximum Performance it skyrockets to 103W just sitting there idle. That made a big difference.
Next, we have the yellow bar which is the GPUz board power. It also all looks the same between the power modes.
Then we look at the green bar which is the peak total system Wattage it also looks the same.
It appears that on this video card the only figure that was affected was the Idle Wattage. Using Optimal Power and Adaptive over Prefer Maximum Performance will indeed help you a great deal on Idle power.
GeForce RTX 2060 SUPER
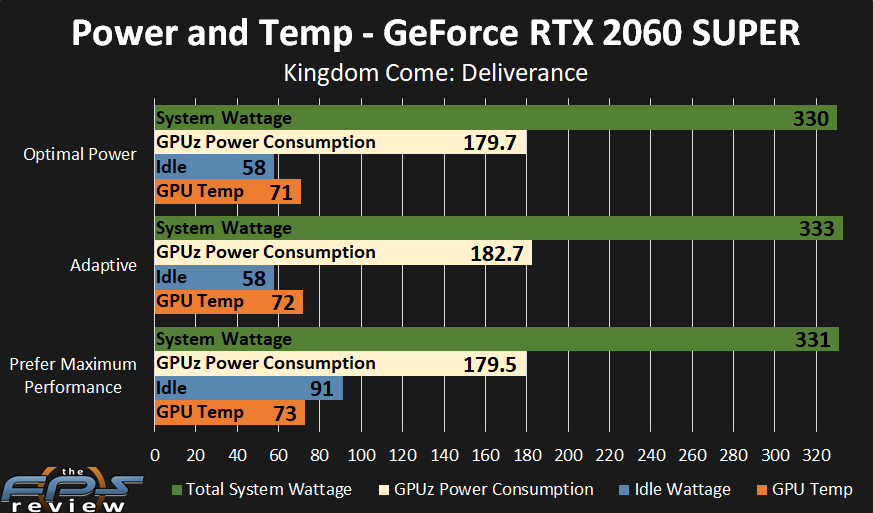
The GeForce RTX 2060 SUPER results are mostly similar. We do see a 2-degree difference though between Optimal Power and Prefer Maximum Performance. It’s not really much, but the RTX 2080 SUPER was a lot closer in differences.
We also see a big difference in Idle power when using Prefer Maximum Performance. It goes from 58W up to 91W, a very big difference for sure.
We see a 3-Watt difference between GPUz Power Consumption numbers between Optimal Power, Maximum Performance and Adaptive. It’s really not much, but it is a bigger difference than the RTX 2080 SUPER anyway.
The total system Wattage also has a 3-Watt variance. Overall, the RTX 2060 SUPER seems to be affected by the power modes slightly more than the RTX 2080 SUPER. However, these differences are so small that other than the Idle Wattage, it doesn’t really make a noticeable difference.
We will have to see what happens in game performance up next.