System Benchmarks
We are going to first start with what we call the “System Benchmarks.” These are benchmarks that test the overall system and provide an overall score number that pertains only to that benchmark. Or, these are benchmarks that test system-specific tests like memory bandwidth and CPU specific tests that spit out a total score number.
PCMark 10
We are starting right off the bat with PCMark 10, a great overall system benchmark. You can download PCMark 10 and run the default standard benchmark like we have to compare your data to ours.
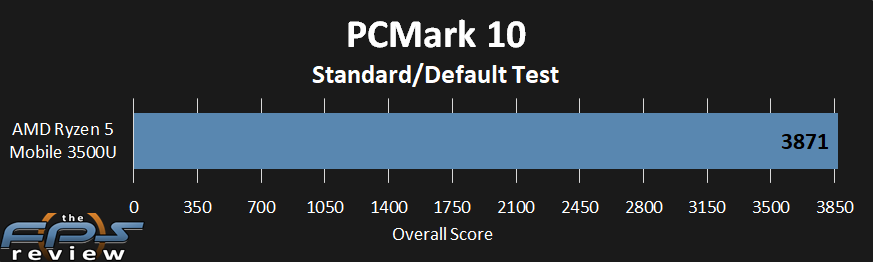
Our overall PCMark 10 score was 3871. We also ran PCMark 10 on our AMD Ryzen 5 3400G desktop APU. The PCMark 10 score there was 6073. That’s about a 57% difference. The TDP and clock speeds are of course different, but they are based on the same Zen+ architecture.
This is, of course, a low number, given the system. If you look through our CPU reviews you can see what results we got on other CPUs in PCMark 10 as well.
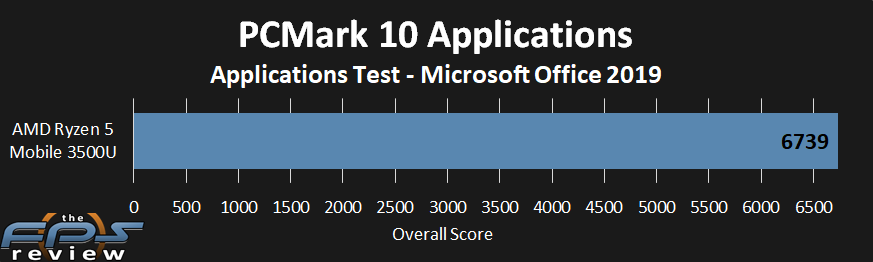
This test in PCMark 10 is a special one and part of our review copy. This is a special Applications test. What this does is test Microsoft Office in various office-related activities to see how good your system is. We are using Office 2019 to be tested via the Applications test. Our overall score ended up being 6739. As we build context with future testing this number will be comparable.
Geekbench 5
The next overall system test is the brand-new version of Geekbench 5. This is a popular benchmark people like to use, and it shows a single-threaded and multi-threaded overall score you can compare. We ran the default CPU test. Grab the program, and run it yourself to compare your results with ours.

In the graph above the CPU Multi-Threaded overall score is 2989 and the CPU Single-Thread is 871.