Memory Bandwidth
AIDA64
This program has many tools for determining memory bandwidth as well as various latency values.
Memory Read
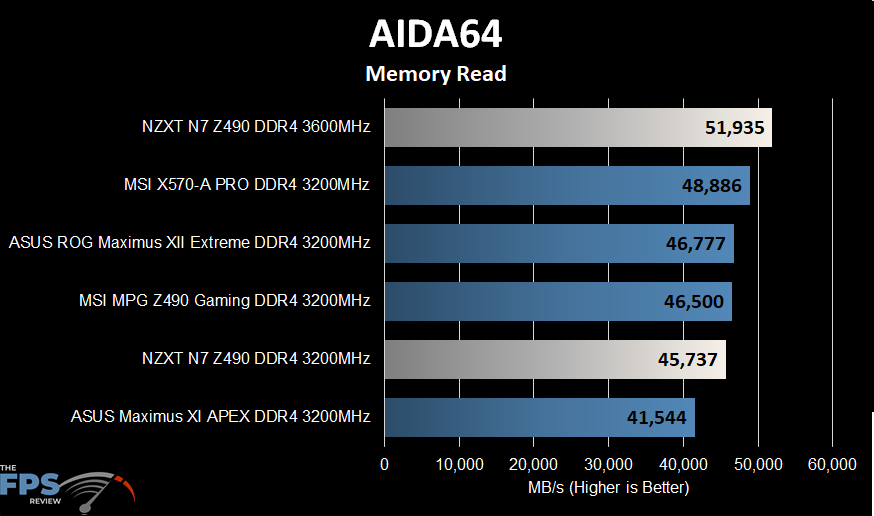
In this test, our NZXT N7 Z490 achieves a result of 45,54MB/s at stock speeds and 51,93MB/s when overclocked. The stock numbers are a little low but in the correct range. The overclocked numbers place it at the top of the chart as expected.
Memory Write
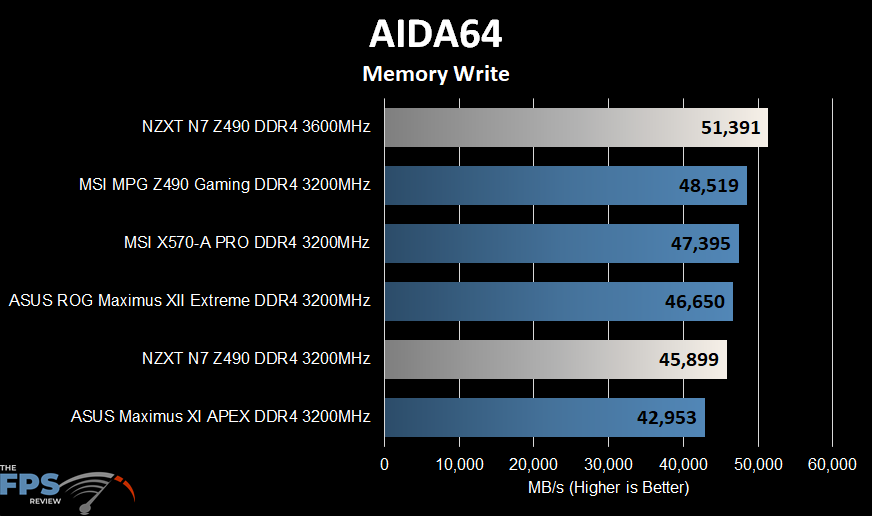
In this test, we see a write speed of 45,899MB/s. This is on the low end of the spectrum as the MSI MPG Z490 achieved a result of 48,519MB/s. When our RAM is taken to DDR4 3600MHz, there are significant gains reaching up to 51,391MB/s in this case.
Memory Copy
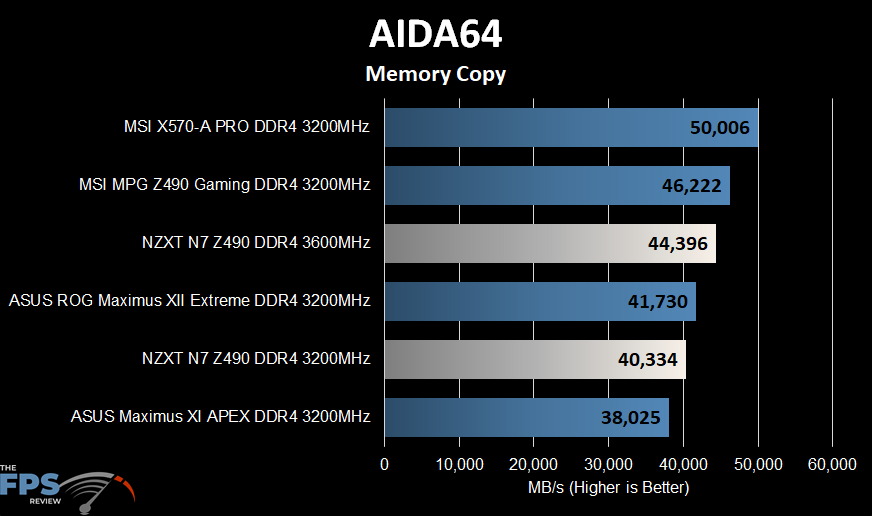
In this test, we see a result of 40,334MB/s in our stock DDR4 3200MHz configuration. At DDR4 3600MHz, we see a performance increase to 44,396MB/s. That’s still oddly low, as other systems were able to achieve more than that at DDR4 3200MHz. Our configuration was checked and rechecked, with this coming out to be the case in each test run.
Sandra Memory Bandwidth
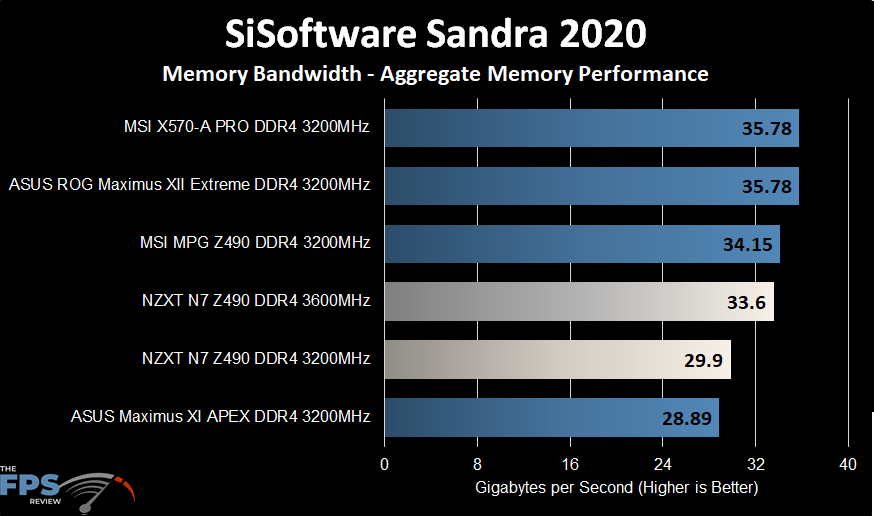
In this test, we see a result of 29.2GB/s, which is definitely on the low end of the spectrum. However, it’s still better than what we saw from the Maximus XI APEX and the 9900K. Again, the results are in the correct range, if a bit low. Overclocked we see unusually low results, and I’m unsure why this is for certain. Usually, this comes down to sub-timings and whether or not the motherboard maker is using the memory manufacturer’s or their defaults.
Application Benchmarks
We are going to start with application and system benchmarks for comparisons, these are the kind of benchmarks that provide an overall performance score to compare with. These are also benchmarks that may either test the system as a whole, including many different real-world workloads, or stress the CPU in ways real-world everyday workloads are performed to produce a performance result.
Geekbench 5
Geekbench 5.1.1 was used for this test. It is a multi-platform test that is comparable across different CPU architectures.
Single Core
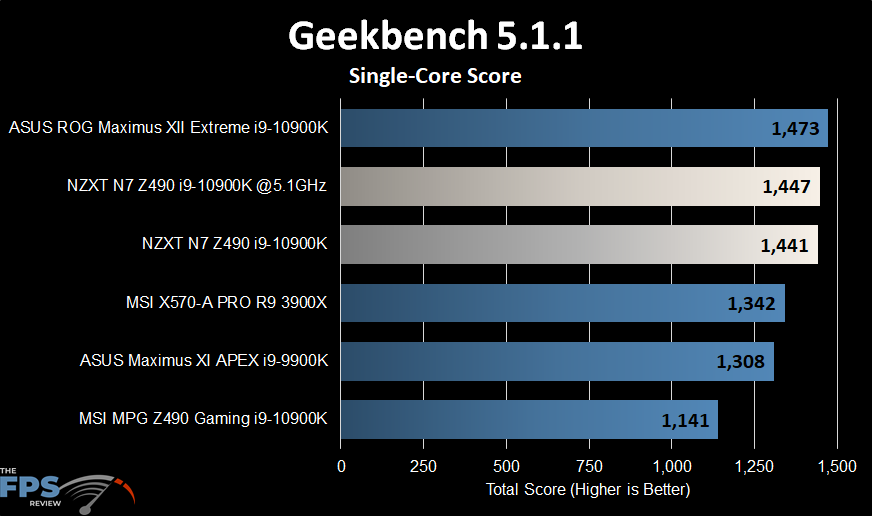
In our Geekbench single-core test, we see results from our NZXT N7 Z490 that are in the same range as the Maximus XII Extreme’s. These are way ahead of the MSI MPG’s score of 1,141.
Multi-Core
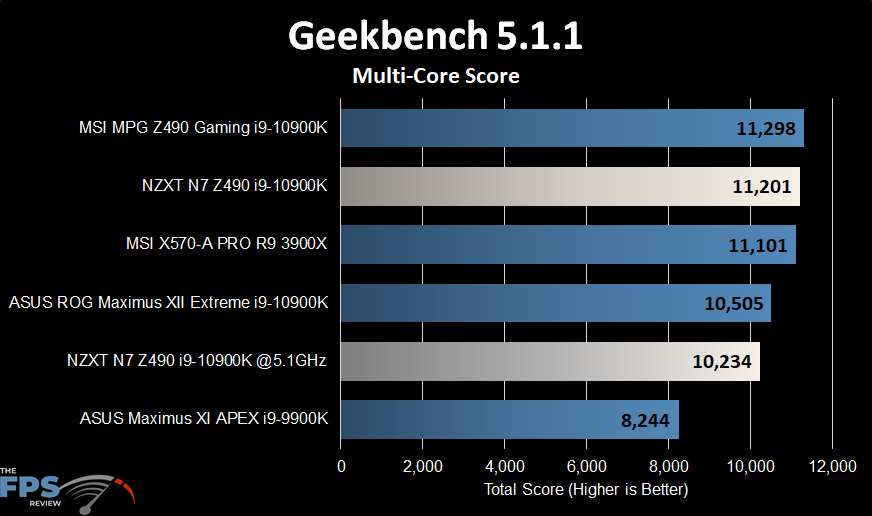
Here we can see the NZXT N7 Z490 scores a 10,234, which falls short of the Maximus XII Extreme. Overclocked, it doesn’t quite match the Z490 Gaming either.
AIDA64 CPU Queen
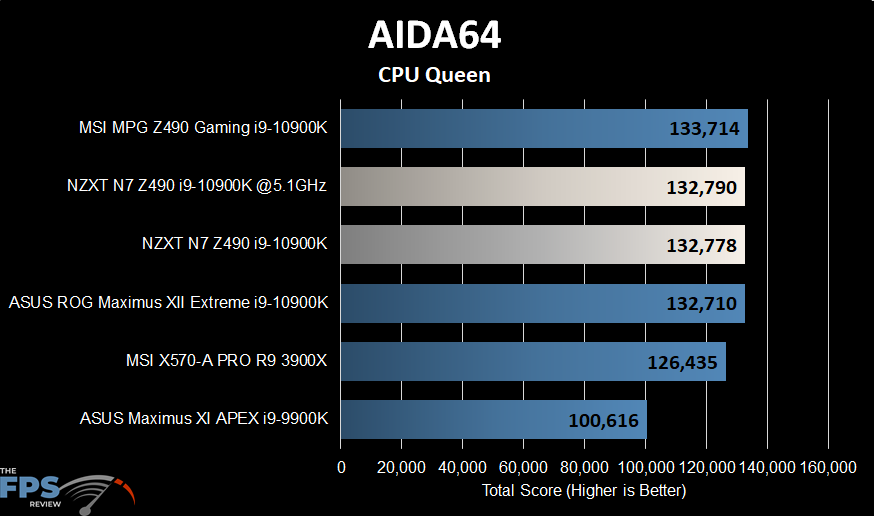
In the AIDA64 CPU Queen test, we see results of 132,778 and 132,790. The overclocked result wasn’t really any faster than the stock one. The range on all of these CPU’s from Intel is almost identical unless you count the aging 9900K.
SiSoft Sandra
We used SiSoftware Sandra version 2020.5.30.41 for all Sandra testing. The processor arithmetic Dhrystone and Whetstone performance results are represented in GFLOPS.
Dhrystone
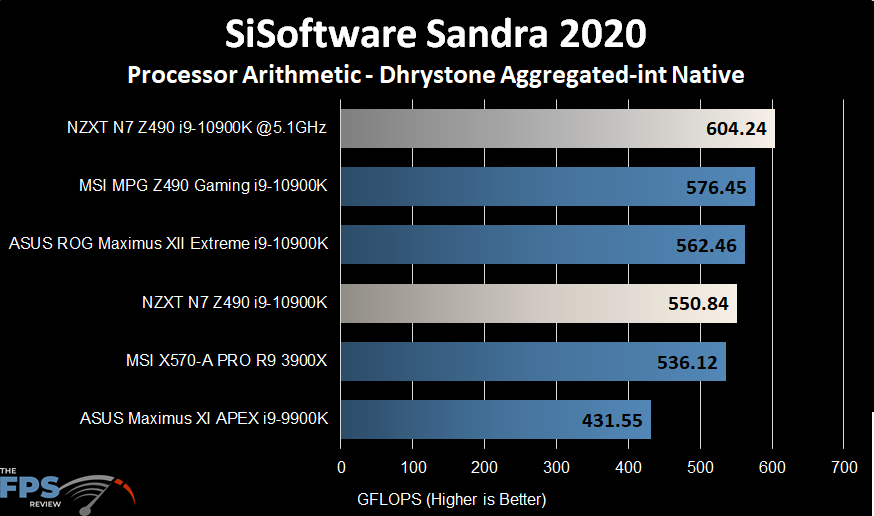
In our first Sandra CPU test, we see the NZXT N7 Z490 scores 550.84 at stock speeds, which is lower than our other 10900K based test systems, but still within the appropriate range. Overclocked, we saw a result of 604.24GFLOPS.
Whetstone
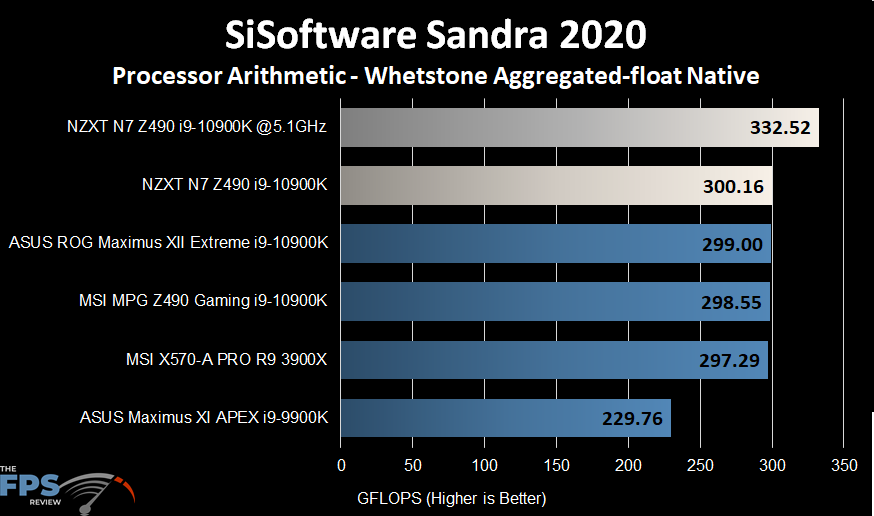
In our second Sandra CPU test, the NZXT N7 Z490 barely scored a 300.16, which puts it just a bit ahead of the competing motherboards. Overclocked, it achieved a result of 332.52GFLOPS.
wPrime
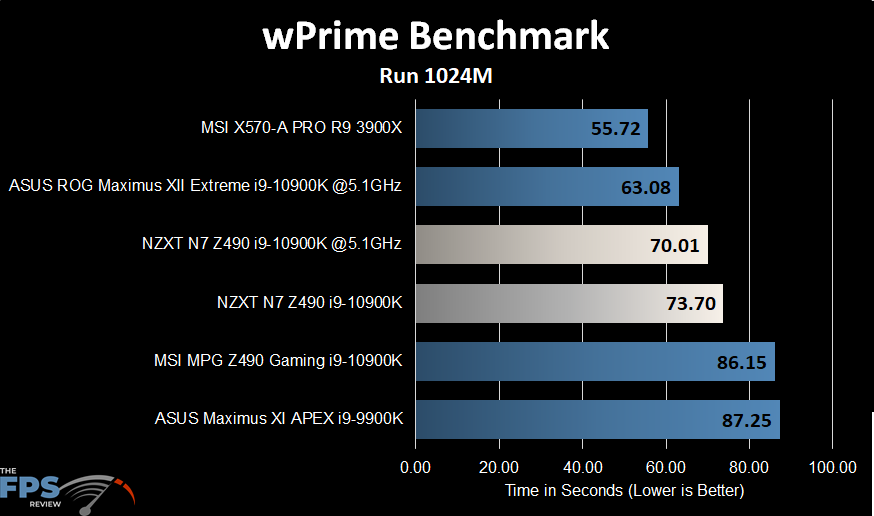
Again, the NZXT N7 Z490 trails the Maximus XII Extreme in this test. Overclocking yielded some improvement, but not a substantial one.
Rendering Benchmarks
Here, we are looking at each CPU’s ability to perform rendering and encoding tasks.
Cinebench R20 Multithread
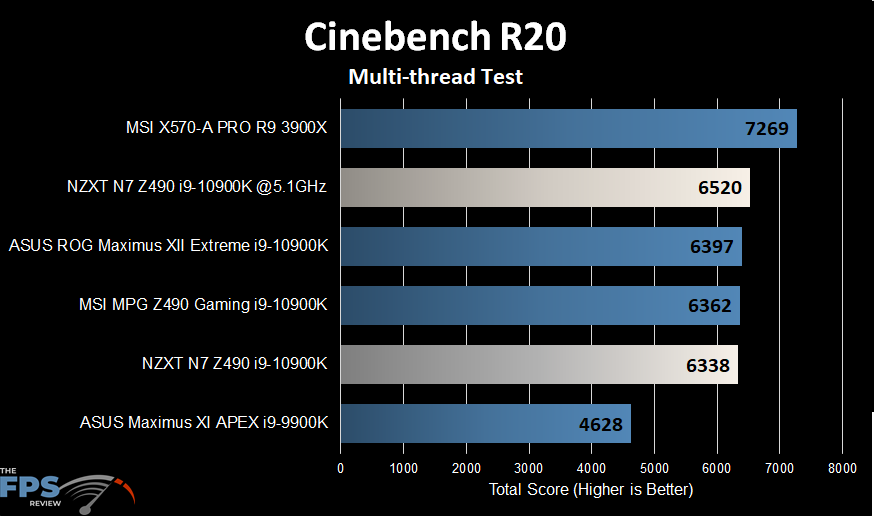
In this test, all of our 10900K based systems score pretty similarly. Overclocking doesn’t help a whole lot here and the AMD CPU’s have a massive advantage due to their higher core count. Therefore, it’s no surprise that the MSI X570-A PRO vastly over-performs comparatively. That being said, the NZXT N7 Z490 does a good job here.
Cinebench R20 Single Thread
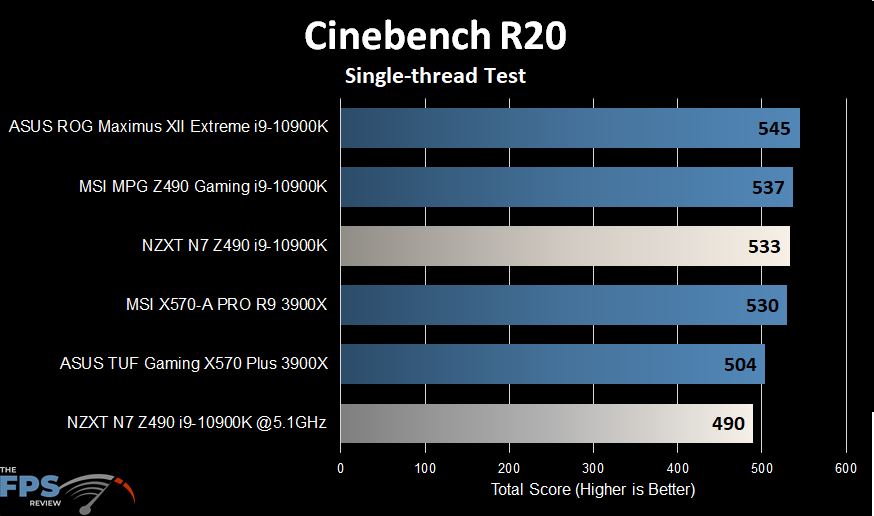
However, in the single-core test, the NZXT N7 Z490 scores on the low side. I’ve seen other test systems in the past score similarly, so it’s not out of the range but it is lower than one would normally expect.
Blender Open Data Benchmark
This is the Blender Open Beta Benchmark version 2.04. This Blender Benchmark allows you to download multiple demos for rendering and render up to six of them in sequence. This can take an extremely long time to run all of them. You also have the option of testing different versions of Blender from the same launcher. We chose two of the tests out of the six, which seemed to have a longer run time than the others.
Blender pavilion_barcelona
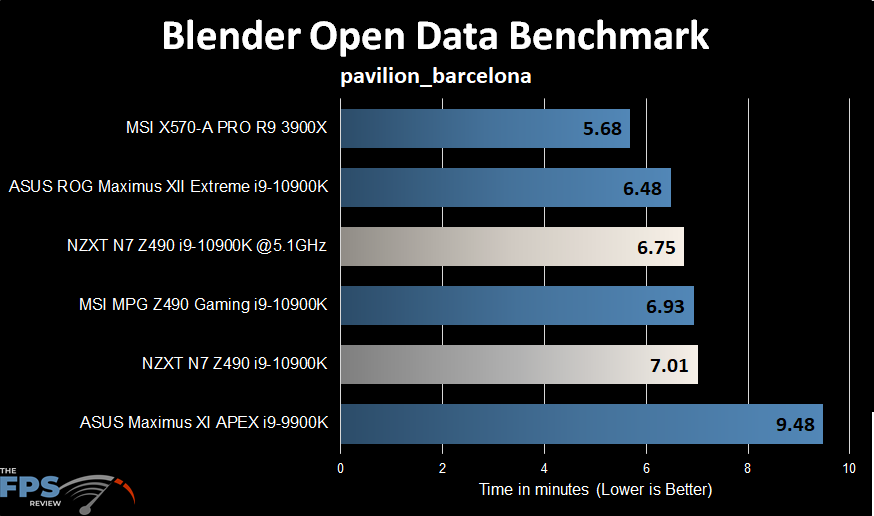
Here we have middling results once again. The NZXT N7 Z490 does its job but still trails the Maximus XII Extreme by a small margin. It should be noted that overclocking all the cores to 5.1GHz yields some benefit here as well.
Blender Victor
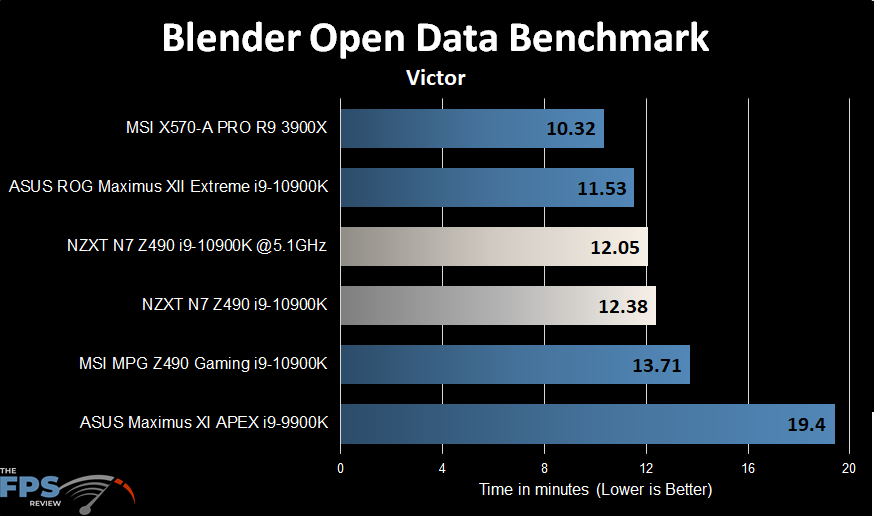
The delta between each of these systems remains similar in the second of our Blender tests with the NZXT N7 Z490 falling somewhere in the middle of the pack. Overclocking helps slightly, but not by much.
V-Ray Benchmark
V-Ray 4.10.07 was used for this test.
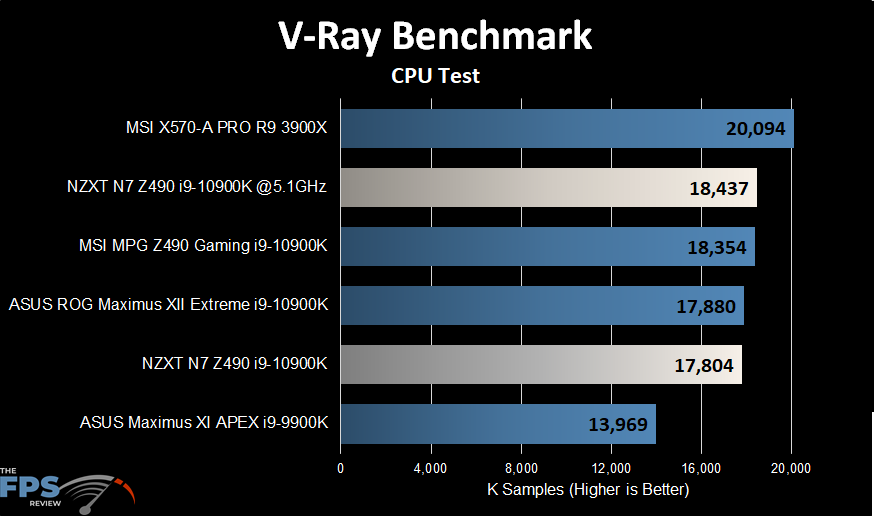
In the V-Ray test, overclocking usually hurts performance, but didn’t in this case for some unknown reason. That being said, the scores were really close to that of the Maximus XII Extreme but fell short of the MSI MPG Z490 Gaming.
Handbrake
This is an encoding using the 1080P fast 30 preset. The only changes made to the application were the disabling of GPU acceleration. The video was a 4K video at 4 minutes and 42 seconds in length.
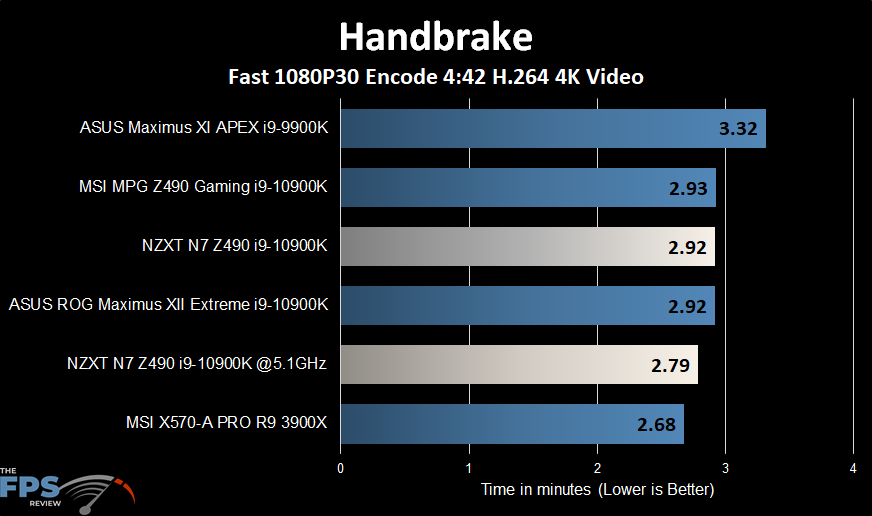
In the Handbrake test, we see a completion time of 2.92 minutes at stock speeds and 2.79 minutes when overclocked. Compare this to the Maximus Extreme, which achieved identical results. The MSI MPG Z490 also completed the task in nearly the same amount of time.
POV-Ray 3.7
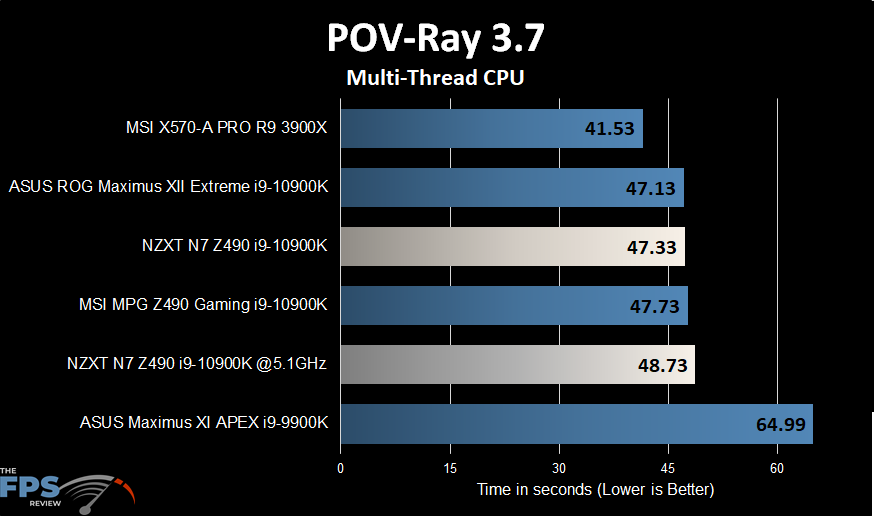
Again, we see all our LGA 1200 motherboards score roughly the same in this test with the differences being attributable to testing variances.