System Benchmarks
Because we do not have direct comparisons we can make to other systems we have evaluated here yet, there is no need to really make every benchmark a bar graph format. Therefore we are going to do something different and just show you a table of all the system benchmarks we ran, and the results. You are welcome to look at past reviews of ours on CPU and motherboard and video card to compare some of these numbers with, though the setup won’t be exact. You can also run these benchmarks on your own computer to compare your results with the results on this system build to see how it compares.

More Benchmarks
Here are some more benchmarks we ran as well, so we will just post a screenshot of the results for each one.
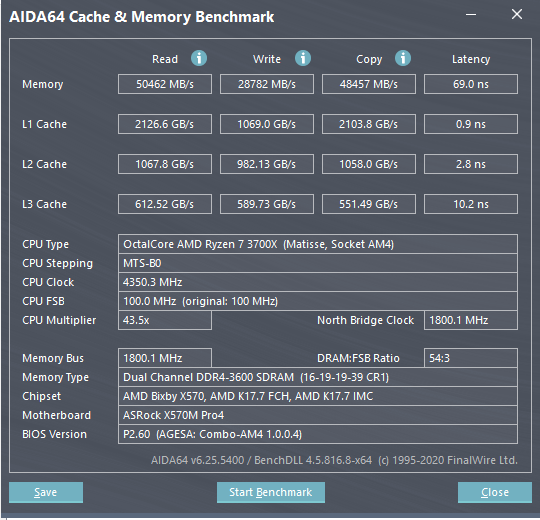
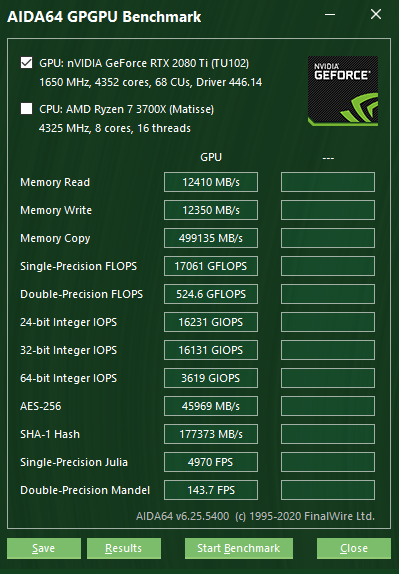
These benchmarks are from Aida64. The first one shows Cache and Memory performance of the system itself. The second screenshot is a GPGPU specific benchmark to show the results of the GPU performing GPGPU workloads. This shows how fast the RTX 2080 Ti is at GPGPU.
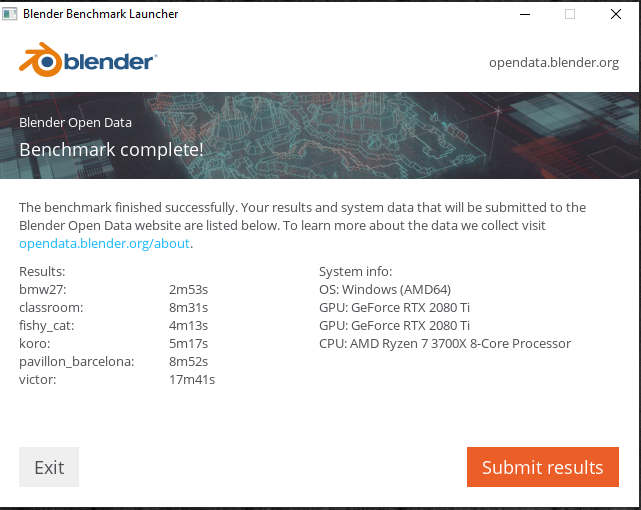
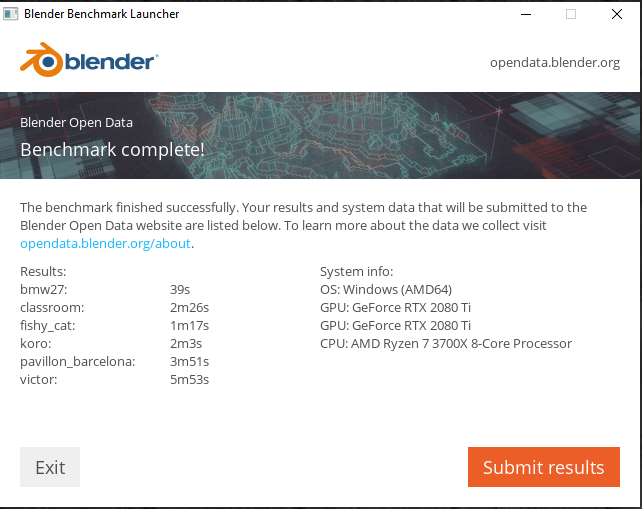
This next benchmark is the Blender Benchmark, but being run two different ways. In the first screenshot, we are running the benchmark on the CPU only, for CPU rendering. For the second screenshot, we are running it on the GPU (RTX 2080 Ti) for GPU rendering. In this way, you can compare and see the advantages of rendering on the GPU versus the CPU by all the time that is saved on the GPU results. Using the GPU really speeds up rendering times by a great deal.
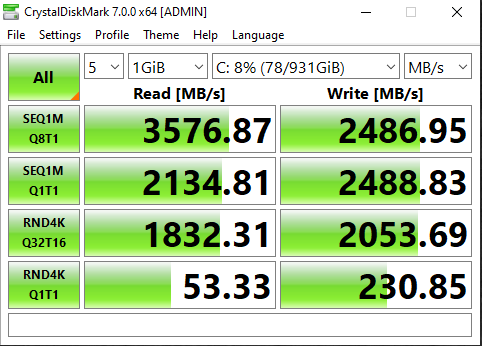
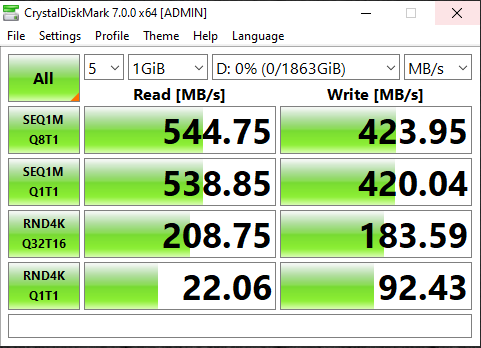
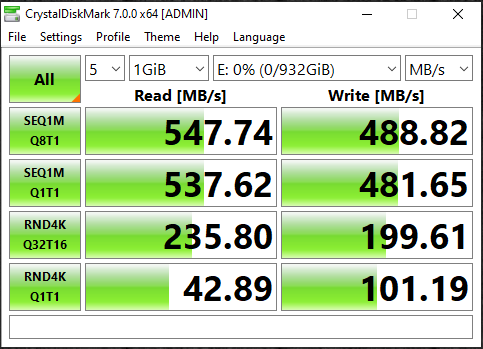
Finally, we are using CrystalDiskMark to benchmark the three SSDs in the system. The first screenshot is of the Samsung 970 EVO NVMe M.2 1TB SSD. You can see the advantage NVMe PCIe 3.0 has, as is reaches 3500MB/s read and almost 2500MB/s write. The second screenshot is the Mushkin 2TB SATA SSD, and it performs as it should at SATA speeds, it has a good read speed, but not the best write speed. Finally the last screenshot is of the Samsung 860 EVO 1TB M.2 SATA SSD. It has a good read speed and a higher write speed than the Mushkin SSD drive.